High-performance .NET by example: Filtering bot traffic
TL;DR
BenchmarkDotNet for benchmarks; Intel VTune Amplifier for low-level optimizations; mistakes and lessons from performance optimizations: from BCL API usage to advanced data structures, from bit hacks to making code CPU-friendlier.
Intro
This post is based on a real-world feature that is used under high-load scenarios. The feature identifies and filters unwanted bot traffic. It’s backed by the Aho–Corasick algorithm, a string searching algorithm that matches many keywords simultaneously.
In this post we explore the domain area, the used algorithm and its original implementation. The post walks through a series of various performance optimization steps: from BCL API usage to advanced data structures, from bit twiddling hacks to addressing CPU cache misses. It also covers tools I usually use to analyze code.
If you find it interesting you can continue reading or jump to any of the sections:
Domain
I work for an advertising technology company. The comics shows the lowdown: 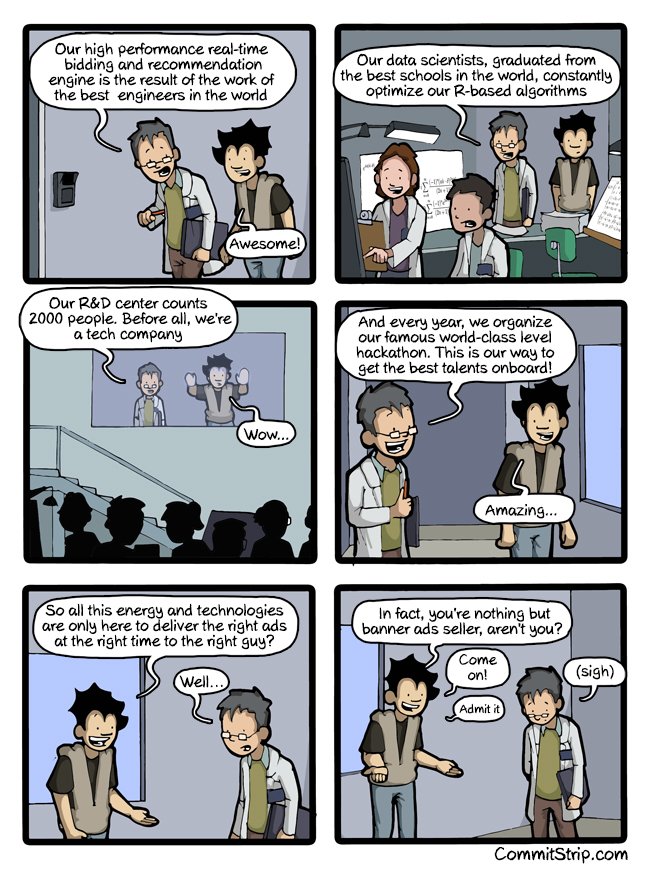
It’s a bit exaggerated but… (sigh) yes, this is all about banners at the end, I’m sorry for this 😞
All websites receive bot traffic! Not a surprise, right? There were quite a few studies from all sides of the advertising business. For instance, the one from Incapsula shows that websites receive 50% of bot traffic in average. Another one from Solve Media shows that bots drive 16% of Internet traffic in the US, this number reaches 56% in Singapore. In general, commercials tend to reduce the numbers, for obvious reasons - a banner impression equals money. Academics and not so involved parties, in their turn, increase the numbers and spread panic, that’s the goal of a research after all. I believe truth is somewhere in the middle.
But, surprisingly, not all bots are bad, and some of them are even vital for the Internet. The classification could look like this:
White bots (good) - various search engine bots like Google, Bing or DuckDuckGo. They are crucial, that’s how we all discover things on the Internet. They respect and follow the robots exclusion protocol (robot.txt), aware of the Robots HTML <META> tag. What’s the most important is that they clearly identify themselves by providing User Agent strings and IP Address lists.
Grey bots (neutral) - feed fetchers, website crawlers and data scrappers. They are similar to the white bots. Except they usually don’t bring users/clients/money directly to a website, but they generate additional load. They may or may not identify themselves, may or may not follow the robots protocol.
Black bots (harmful) - fraud and criminal activity, intentional impersonation for profit. They imitate user behavior to harm or make fake impression, clicks, etc.
We won’t cover black bots because it is a huge topic with sophisticated analysis and Machine learning algorithms. We will focus on the white and grey bots that identify themselves as such.
There’s no reason to show a banner for a bot, right? It’s pointless, waste of resources and money. What’s the most important is that clients don’t want to pay for that and our goal is to filter all bots out. There are several ways to identify bot traffic, e.g., IP addresses, behavior analysis, honeypots, etc. One of the ways that became a standard in the industry is to use a defined list of User Agent strings. Advertising companies are required to have it to be compliant to standards. Let’s take a look at an example.
My browser’s user agent string looks like this at the moment: Mozilla/5.0 (Windows NT 10.0; WOW64) AppleWebKit/537.36 (KHTML, like Gecko) Chrome/57.0.2987.133 Safari/537.36 Yes, I use Chrome on Windows 10.
One of the Google’s crawlers has the following user agent: Mozilla/5.0 (compatible; Googlebot/2.1; +http://www.google.com/bot.html)" As you can see it has Googlebot keyword and a link with the information about itself. Google shares information on their bots and how to identify them.
There are various bot user agent lists available on the Internet for free. But… There’s The Interactive Advertising Bureau (IAB) which “is an advertising business organization that develops industry standards, conducts research, and provides legal support for the online advertising industry.” They maintain their own “International Spiders and Bots List” (which costs… wait WHAT? $14000 for non-members??? Holy moly!) The list “is required for compliance to the IAB’s Client Side Counting (CSC) Measurement Guidelines”. Oh, this is what “develops industry standards” means; everything fell into place. It seems that we don’t have much choice here 😀
The bot list contains a list of string tokens that we can find in user agent strings. There are hundreds of those tokens. The simplified version looks like this.
googlebot
bingbot
twitterbot
duckduckbot
curl
...
All we need is to find any of those tokens in a user agent and, if there’s a match, filter the request out as it comes from a bot.
The feature is used in few high-load systems like Real-time bidding, Ad serving and some others. Yes, this is all about banners (sigh).
Measure, measure, measure!
“If you can not measure it, you can not improve it.” Lord Kelvin
That’s basically it. Measurement is vital! It’s difficult to add anything to that.
Measurement is hard! Variety of versions, libraries, languages, OSes, hardware, tools only aggravate the situation.
Essentially you are interested in two levels, let’s call them macro and micro. On macro level, metrics and macro-benchmarks help you understand how your code works in production on real data and show the real impact of changes. On micro level, microbenchmarks are crucial. They provide fast feedback and increase confidence. They are like unit tests where performance is a feature. Microbenchmarking is hard!
Microbenchmarking DOs & DON’Ts from Microsoft:
- DO use a microbenchmark when you have an isolated piece of code whose performance you want to analyze.
- DO NOT use a microbenchmark for code that has non-deterministic dependences (e.g. network calls, file I/O etc.)
- DO run all performance testing against retail optimized builds.
- DO run many iterations of the code in question to filter out noise.
- DO minimize the effects of other applications on the performance of the microbenchmark by closing as many unnecessary applications as possible.
Your development pipeline looks like the following:
A feature -> C# code
C# code + Compiler -> IL assembly
IL assembly + BCL + 3rdParty libs -> Application
Application + CLR -> ASM
ASM + CPU -> Result
And variety of implementations:
C# Compilers: Legacy, Roslyn
IL Compilation: JIT, NGen, MPGO, .NET Native, LLVM
JITs: Legacy x86 & x64, RyuJIT, Mono
CLRs: CLR2, CLR4, CoreCLR, Mono
GCs: Microsoft GC (few modes), Boehm, Sgen
OSes: Windows, Linux, OS X
Hardware: ...
Algorithm
Before any performance optimization (How fast?) we think about efficiency (How much work do we need to do?). Our goal is to check whether a user agent string contains any of the given tokens. We have several hundred tokens. We perform the check once per network request. We don’t need to find all patterns or to know which of them matched; we need to answer: yes or no. Basically, omitting all unnecessary details, our problem comes down to the multiple string matching problem.
Multiple string/ pattern matching problem is an important problem in many areas of computer science. For example, spam detection, filtering spam based on the content of an email is a very popular technique. Another application is plagiarism detection, using pattern matching algorithms we can compare texts and detect similarities between them. An important usage appears in biology, matching of nucleotide sequences in DNA is an important application of multiple pattern matching algorithms ![]() There’s application in network intrusion detection systems and anti-virus software, such systems should check network traffic and disks content against large amount of malicious patterns. Aaaaaaand we have banners…
There’s application in network intrusion detection systems and anti-virus software, such systems should check network traffic and disks content against large amount of malicious patterns. Aaaaaaand we have banners…
There are several string searching algorithms and few of them work with a finite set of patterns. The most suitable for our needs is Aho–Corasick algorithm. It was invented by Alfred V. Aho and Margaret J. Corasick back in 1975.
Key features of the Aho–Corasick algorithm:
- a pattern matching algorithm
- accepts a finite set of patterns
- matches all patterns simultaneously
- constructs a finite state machine from patterns backed by a Trie
- constructs additional “failure” links between nodes that allows to continue traversal in case of match failure
“The complexity of the algorithm is linear in the length of the strings plus the length of the searched text plus the number of output matches. Note that because all matches are found, there can be a quadratic number of matches if every substring matches” We aren’t interested in the output and can stop when any match is found; the complexity is much better for us.
The algorithm was used in the fgrep utility (an early version of grep). You can play with an animated version of the algorithm here.
Tools
BenchmarkDotNet
BenchmarkDotNet is a powerful FOSS .NET library for benchmarking. It is like NUnit for unit tests, it provides fast feedback for code changes. I believe that it’s a must to have it in your solution even if you don’t write high-performance code.
“Benchmarking is really hard (especially microbenchmarking), you can easily make a mistake during performance measurements. BenchmarkDotNet will protect you from the common pitfalls…” It supports Full .NET Framework, .NET Core, Mono, x86, x64, LegacyJit and RuyJIT, and works on Windows, Linux, MacOS. It has some useful diagnosers based on ETW events like GC and Memory allocation, JIT Inlining and even some hardware counters.
You can find documentation and how to use it on its website; review, give a star or even contribute on github.
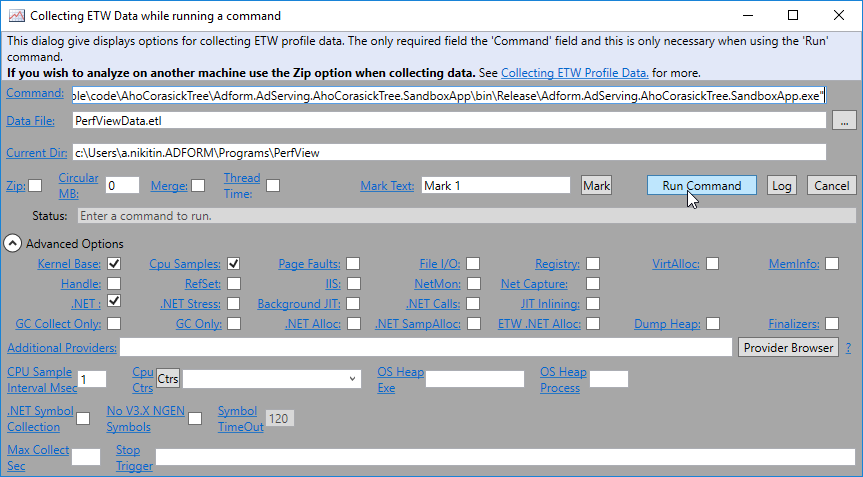
PerfView
PerfView is a general purpose performance analysis tool for .NET. It’s like a Swiss army knife and can do many things, from CPU and Memory profiling to heap dump analysis, from capturing ETW events to hardware counters like CPU cache misses, branch mispredictions, etc. It has an ugly interface but after few days weeks you will find it functional. That’s what it’s called - “functional”. I believe that PerfView is a great tool to have in your tool belt. It’s FOSS with the sources hosted on github.
Intel VTune Amplifier
Intel VTune Amplifier is a commercial application for software performance analysis. It supports many programming languages including C#. In my opinion, it’s the best tool for the low-level performance analysis on the market. It shows not only what code CPU executes but how it does that. It answers not only how long CPU executes something but why it takes that much time. It exposes hundreds of hardware! counters and registers. It has low overhead hence. You can read about it on the Intel website BTW, VTune Amplifier has pretty good documentation and explanation for all major metrics.
ILSpy
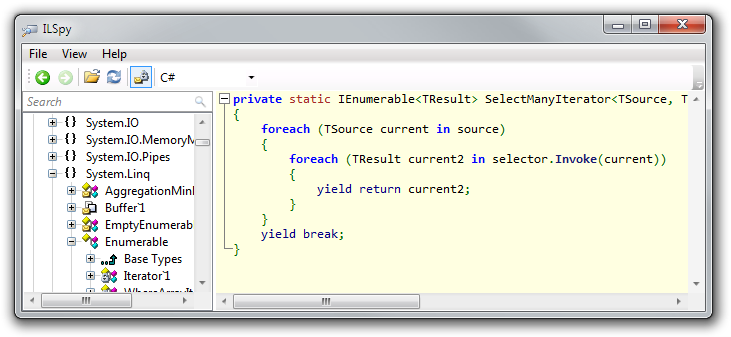
“ILSpy is the open-source .NET assembly browser and decompiler.” It is a great tool, simple and easy to use; very useful when you want to understand how C# compiler compiles your code.
To be fair, there are other free and great tools like dotPeek or JustDecompile. I prefer ILSpy because it’s FOSS (the sources on github).
WinDbg
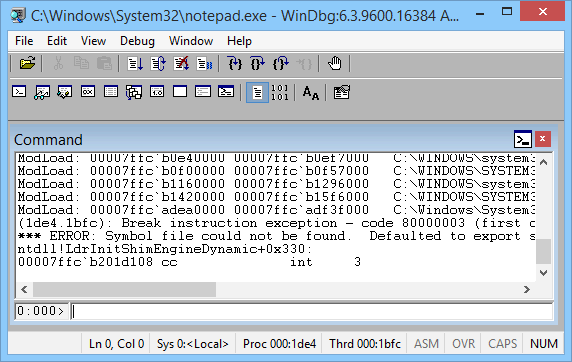
WinDbg - the great and powerful! It is a powerful debugging and exploring tool for Windows. It can be used to debug user applications, device drivers, and the operating system itself. I use it to understand CLR internals, get assembly code, analyze process dumps or debug an ugly problem.
There are few extensions to help us with that:
- SOS (Sun of Strike): provides information about the internal (CLR) environment. SOS is distributed with the .NET Framework.
- SOSex: useful extenstions by Steve Johnson.
- WinDbgCs: This is an interesting option to execute C# scripts inside WinDbg and automate some analysis.
I find the “Debugging .NET with WinDbg” document by Sebastian Solnica concise and good as an intro and a reference book.
Performance optimizations
To be fair, the feature and algorithm were implemented by another developer. My interest in this case lies mostly in the performance field. You can find the original algorithm code in this gist.
Let’s quickly walk through the code and review the hot path. We have the AhoCorasickTree class that contains logic on how to build itself and traverse/ search for patterns. The hot path starts from the Contains() method. There’s an awkward nesting of methods. The ref keyword always makes me worry. Here’s the excerpt code:
public class AhoCorasickTree
{
    internal AhoCorasickTreeNode Root { get; set; }

    ...

    public bool Contains(string text)
    {
        return Contains(text, false);
    }

    private bool Contains(string text, bool onlyStarts)
    {
        var pointer = Root;

        foreach (var c in text)
        {
            var transition = GetTransition(c, ref pointer);

            if (transition != null)
                pointer = transition;
            else if (onlyStarts)
                return false;

            if (pointer.Results.Any())
                return true;
        }
        return false;
    }


    private AhoCorasickTreeNode GetTransition(char c, ref AhoCorasickTreeNode pointer)
    {
        AhoCorasickTreeNode transition = null;
        while (transition == null)
        {
            transition = pointer.GetTransition(c);

            if (pointer == Root)
                break;

            if (transition == null)
                pointer = pointer.Failure;
        }
        return transition;
    }

    ...
}
The tree class consists of AhoCorasickTreeNode nodes. The AhoCorasickTreeNode class backed by Dictionary<char, AhoCorasickTreeNode> for character keys and nested nodes, it stores its results in List<string>.
internal class AhoCorasickTreeNode
{
    public char Value { get; private set; }
    public AhoCorasickTreeNode Failure { get; set; }
    public IEnumerable<string> Results { get { return _results; } }
    private readonly Dictionary<char, AhoCorasickTreeNode> _transitionsDictionary;

    ...

    public AhoCorasickTreeNode GetTransition(char c)
    {
        return _transitionsDictionary.ContainsKey(c)
                   ? _transitionsDictionary[c]
                   : null;
    }

    ...
}
Basically this would be enough to start with.
Measurement
Following the main principle, we want to have a reliable way to measure the performance and further code changes. BenchmarkDotNet will help us with that, it is as simple as installing the library via NuGet and creating a test method with a [Benchmark] attribute.
A simple benchmark for a common user agent string could looks like this:
public class SimpleManyKeywordsBenchmark
{
    // a common user agent string
    private const string UserAgent = "Mozilla/5.0 (Windows NT 6.1) AppleWebKit/537.36 (KHTML, like Gecko) Chrome/41.0.2228.0 Safari/537.36";

    // create the SUT
    private readonly AhoCorasickTree _tree;
    public SimpleManyKeywordsBenchmark()
    {
        _tree = new AhoCorasickTree(ResourcesUtils.GetKeywords().ToArray());
    }

    [Benchmark]
    public bool Baseline()
    {
        return _tree.Contains(UserAgent);
    }
}
And the BenchmarkDotNet’s output results:
BenchmarkDotNet=v0.10.3.0, OS=Microsoft Windows NT 6.2.9200.0
Processor=Intel(R) Core(TM) i7-4600U CPU 2.10GHz, ProcessorCount=4
Frequency=2630635 Hz, Resolution=380.1364 ns, Timer=TSC
  [Host]     : Clr 4.0.30319.42000, 64bit RyuJIT-v4.6.1637.0
  Job-ECROUK : Clr 4.0.30319.42000, 64bit RyuJIT-v4.6.1637.0

Jit=RyuJit  Platform=X64  LaunchCount=5
TargetCount=20  WarmupCount=20
| Method | Mean | StdDev |
|---|---|---|
| Baseline | 6.1364 us | 0.0314 us |
This means that we need only 6 microsecond to check a common user agent string against several hundreds of patterns. We can do ~150K calls per second on one CPU Core which is pretty fast and good enough. But can we do better?
APIs of Libraries
During the code review, the attentive reader may have noticed that there’s the following code in the hot path:
public AhoCorasickTreeNode GetTransition(char c)
{
    return _transitionsDictionary.ContainsKey(c)
               ? _transitionsDictionary[c]
               : null;
}
We have two calls to the dictionary: one to check whether the dictionary has the key or not, and then we get the next node. But we all know that there is a single method that can do both at once: bool TryGetValue(TKey key, out TValue value). Let’s fix that:
public AhoCorasickTreeNode GetTransition(char c)
{
    _transitionsDictionary.TryGetValue(c, out AhoCorasickTreeNode node);
    return node;
}
And the results:
| Method | Mean | StdDev | Median | Scaled | Scaled-StdDev |
|---|---|---|---|---|---|
| Control | 6.1577 us | 0.0523 us | 6.1466 us | 1.00 | 0.00 |
| Treatment | 5.8706 us | 0.0432 us | 5.8850 us | 0.95 | 0.01 |
This was easy, almost 5% improvement just using proper API methods. Lesson learnt: know APIs of libraries you use. Let’s move to profiling.
CLR internals
Let’s start from the high-level analysis and try to understand how the code performs. PerfView is the best tool for the high-level general purpose analysis. What we need is to create an isolated console application that executes the code in a loop with close to production usage. Let’s launch PerfView and profile the application using its functional UI.
PerfView shows a lot of useful .NET related (and system wide) information. For example JIT and GC stats. For instance, we can take a look at the activity of the GC in the “GCStats” view under the “Memory Group” folder. If we open the view for our application it shows us that the GC is pretty busy allocating and cleaning garbage up:
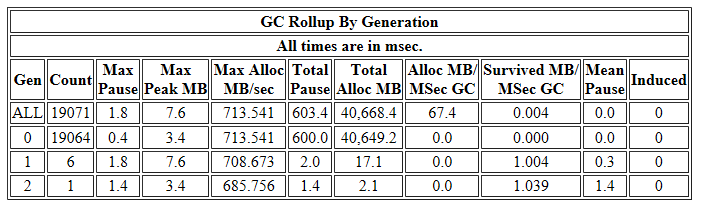
Hmmm… That’s not what I would expect. We iterate over a string and traverse a prebuilt Trie. Why would we ever need to allocate anything just to traverse the tree?? Luckily PerfView is able to trace allocation object stack traces. Let’s enable the “.NET SampleAlloc” option and switch to the “GC Heap Net Mem stacks” view. If we take a look at the allocation stacktrace:
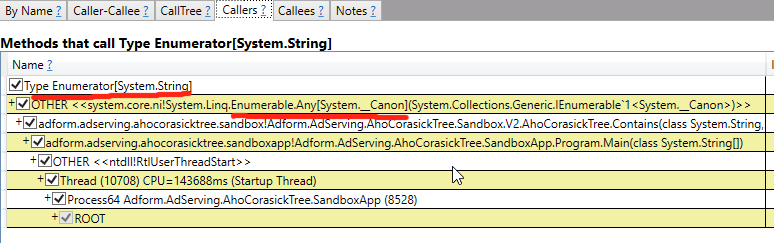
We find that we allocate an instance of Enumerator[String] class, which is List<String>.Enumerator in our case, in the Any<T>() method. Wait a second?! We all know that List’s enumerator is a struct. How is that possible to have a struct on the heap? Let’s go up the stack and find that out. The Any<T> IEnumerable extension implementation:
public static bool Any<TSource>(this IEnumerable<TSource> source)
{
  ...
  using (IEnumerator<TSource> enumerator = source.GetEnumerator())
  {
    if (enumerator.MoveNext())
      return true;
  }
  return false;
}
Here we call the GetEnumerator() method to get an enumerator. The List’s GetEnumerator() implementation:
public class List<T> : ... IEnumerable<T> ...
{
  ...
    IEnumerator<T> IEnumerable<T>.GetEnumerator()
    {
      return (IEnumerator<T>) new List<T>.Enumerator(this);
    }
}
We create an instance of the Enumerator struct, cast it to the IEnumerator<T> interface and return it as an interface. To make it clearer we need to dig deeper. ILSpy will help us here. Let’s launch ILSpy and review the IL code:
...
IL_0000: ldarg.0
IL_0001: newobj instance void valuetype System.Collections.Generic.List`1/Enumerator<!T>::.ctor(class System.Collections.Generic.List`1<!0>)
IL_0006: box valuetype System.Collections.Generic.List`1/Enumerator<!T>
IL_000b: ret
Indeed we clearly see the boxing operation. The reason for the boxing is that a call to an interface method happens via a Virtual Method Table. The compiler doesn’t know the type behind the interface. A value type doesn’t have a virtual method table by nature; to obtain one it has to become a reference type with all its consequences like a header, method table, heap allocation.
Knowing this fact, the fix is quite easy, let’s get rid of the IEnumerable<T> interface for the sake of the exact List<T> type and check for Count > 0 instead of Any().
| Method | Mean | StdDev | Median | Scaled | Scaled-StdDev |
|---|---|---|---|---|---|
| Control | 5.7016 us | 0.0669 us | 5.6759 us | 1.00 | 0.00 |
| Treatment | 2.8440 us | 0.0357 us | 2.8433 us | 0.50 | 0.01 |
Wow, that’s 2 times faster! We achieved that just joggling .NET internals. Lesson learnt: It’s important to understand how CLR works.
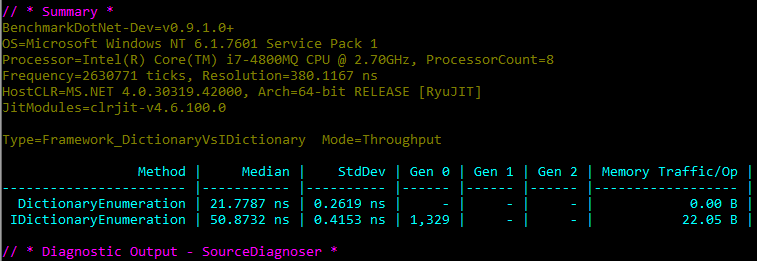
BCL Data Structures
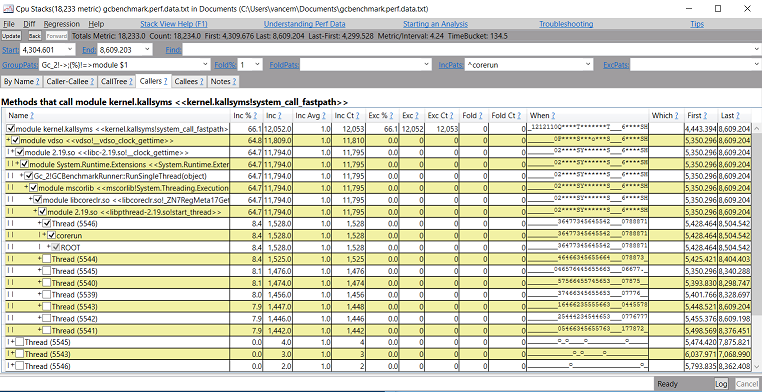
Now it’s time to find the bottleneck of the code. Let’s launch PerfView again and profile the application. At this time we are interested in the “CPU Stacks” view:
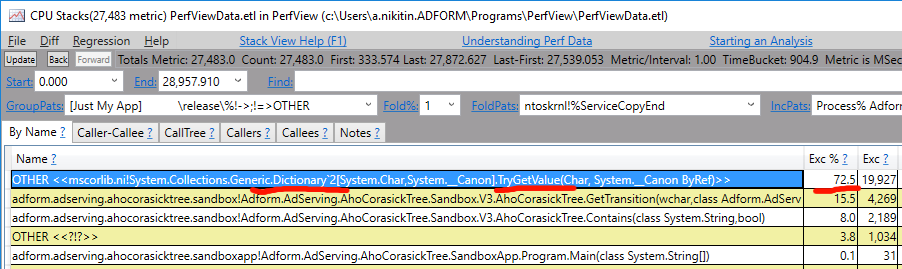
PerfView shows that the bottleneck is in the BCL Dictionary data structure. This will stop most developers from further work. Dictionary (a hash table) is an awesome data structure. It’s generic, it’s fast, it’s efficient memory-wise. It was bestowed upon us from the above! 😇
But, out of curiosity, let’s take a look at how it works under the hood. The TryGetValue method, identified as the bottleneck, calls the FindEntry method under the hood which looks like this:
private int FindEntry(TKey key)
{
  if ((object) key == null) ThrowHelper.ThrowArgumentNullException(ExceptionArgument.key);
  if (this.buckets != null)
  {
    int num = this.comparer.GetHashCode(key) & int.MaxValue;
    for (int index = this.buckets[num % this.buckets.Length]; index >= 0; index = this.entries[index].next)
    {
      if (this.entries[index].hashCode == num && this.comparer.Equals(this.entries[index].key, key))
        return index;
    }
  }
  return -1;
}
The first thing is the this.comparer.GetHashCode() call where this.comparer is an IEqualityComparer<TKey> implementation. That makes the call a virtual interface call which cannot be inlined. All the same with the this.comparer.Equals() interface call. The call stack of the hot path looks like the following in our case:
Dictionary<TKey, TValue>.TryGetValue()
  Dictionary<TKey, TValue>.FindEntry()
    GenericEqualityComparer<T>.GetHashCode()
      Char.GetHashCode() (inlined)
    GenericEqualityComparer<TKey>.Equals()
      Char.Equals() (inlined)
    // repeat if hash collision
That’s intelligible. Dictionary is a generic general purpose data structure, it must handle any type and any scale equally well. But we know all our types, hence we don’t need that generic solution.
Let’s just re-implement a classic hash table for the char type and inline it into the AhoCorasickTreeNode class. All we need is an array for buckets which points to an array of values. Basically we removed all unnecessary code and flatten the call stack. The code in that case could look like this:
internal class AhoCorasickTreeNode
{
  private int[] _buckets;
  private Entry[] _entries;
  ...

  public AhoCorasickTreeNode GetTransition(char c)
  {
      var bucket = c % _buckets.Length;
      for (int i = _buckets[bucket]; i >= 0; i = _entries[i].Next)
      {
          if (_entries[i].Key == c)
          {
              return _entries[i].Value;
          }
      }

      return null;
  }

  ...
}
The benchmark results:
| Method | Mean | StdDev | Scaled | Scaled-StdDev |
|---|---|---|---|---|
| Control | 2.7514 us | 0.0249 us | 1.00 | 0.00 |
| Treatment | 1.7416 us | 0.0216 us | 0.63 | 0.01 |
Yeah, that’s 1.6 time faster than the previous version. So far so good. Lesson learnt: BCL has general purpose code; it may be useful to re-implement some code for your needs.
How CPU works
Now we came to the point when it’s important to understand how CPU works to perform analyses and optimizations. Here’s a necessary picture to show how complex CPUs are:
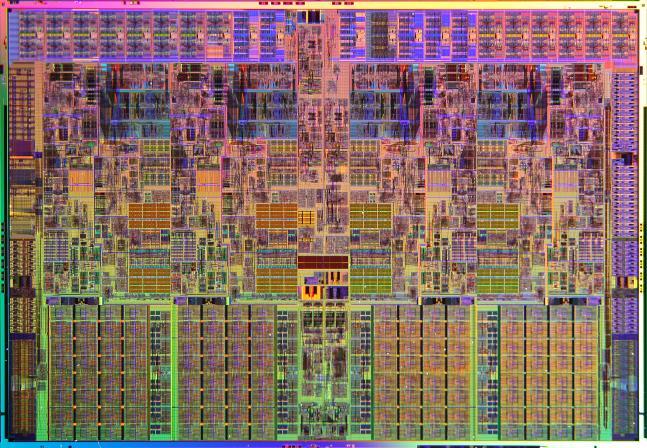
Yes, a modern CPU is a complex beast and I’m not in a position to explain you how it works, especially within a blog post. I just want to give a starting point, from where you can start the journey. One of the best starting points is the “Central processing unit” wikipedia page.
In few words, CPU is a message passing system with multiple cache layers. Accessing next cache layer is much slower than the previous one. CPU cores exchange messages to keep cache coherent. For example, cache layers and latency for my Intel i7-4770 (Haswell) are the following:
Caches:
Cache line = 64 bytes
L1 Data cache = 32 KB
L1 Instruction cache = 32 KB
L2 cache = 256 KB
L3 cache = 8 MB

Latency:
L1 Data Cache Latency = 4 cycles for simple access via pointer
L1 Data Cache Latency = 5 cycles for access with complex address calculation
L2 Cache Latency = 12 cycles
L3 Cache Latency = 36 cycles
RAM Latency = 36 cycles + 57 ns
Essentially, CPU can be divided into the Front-end and the Back-end. The Front-end is where instructions are fetched and decoded. The Back-end is where the computation performed. That concept drives all CPU optimizations. For example the Front-end can rearrange the order in which instructions are executed; it can try to predict branches and speculatively push more instructions, even if they may not be needed. The Back-end in its turn has several parallel execution units, e.g., arithmetic logic unit (ALU), floating-point unit (FPU), load-store unit (LSU); It’s capable of executing few instruction per cycle.
Maximum IPC (instructions per cycle)
There’s a question on Stack Overflow, a developer asks a pretty serious and interesting question: “How to achieve the theoretical maximum number of operations per CPU cycle?”

But the answer is rather entertaining, another developer has achieved that but to measure CPU temperature 😆
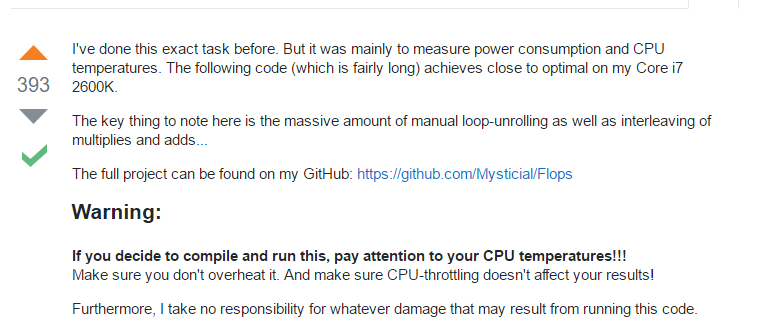
His code looks like this:
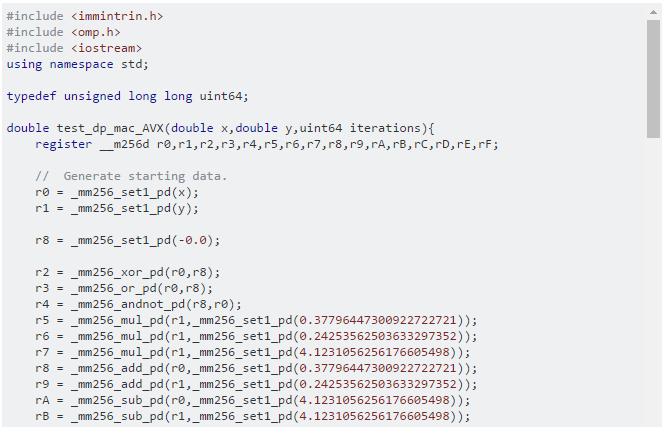
And many more lines like that. That’s basically assembly code written in C++ that works directly with CPU registers and instructions. It is amazing how much power and control C++ gives you. The author warns you: “If you decide to compile and run this, pay attention to your CPU temperatures!!! … I take no responsibility for whatever damage that may result from running this code.”
Further reading: “Intel 64 and IA-32 Architectures Software Developer Manuals” and “Intel 64 and IA-32 Architectures Optimization Reference Manual” are the most thorough manuals I’ve seen. I haven’t read them all though and use them as a reference mostly.
Advanced data structures
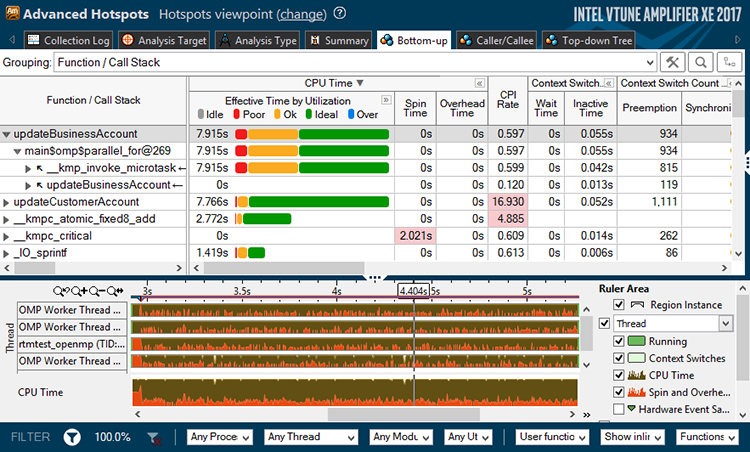
At this point PerfView won’t show us any useful insight. It’s time for the heavy artillery - Intel VTune Amplifier! It is a very powerful instrument for low-level profiling. VTune has several predefined analysis types.
The Advanced Hotspots analysis is the best place to start from. Event-based sampling analysis that monitors all the software on your system including the OS. As the name says it’s useful to identify bottlenecks. We already identified the bottleneck using PerfView. Let’s continue.
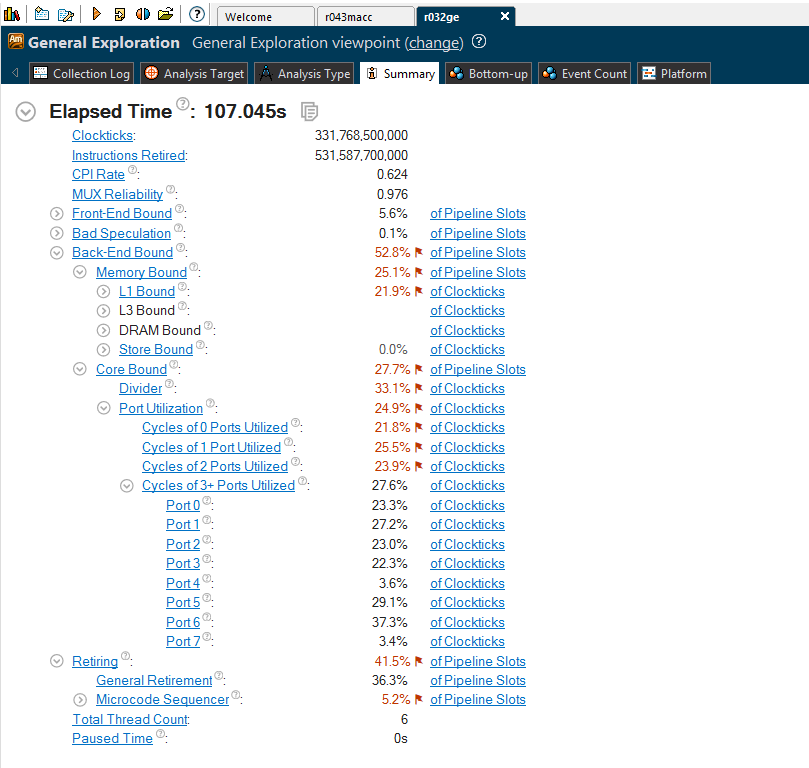
The General Exploration analysis helps identify hardware issues affecting the performance. It collects a comprehensive list of CPU hardware registers available for analysis. It’s a good starting point when you do hardware-level analysis. It can help you understand how efficiently your code is executing. It provides a neat summary view, from where you can start analyzing issues. For our latest version it produced the following summary:
Memory Access analysis helps identify memory-related issues, like CPU cache misses, NUMA problems and bandwidth-limited accesses. It uses hardware event-based sampling to collect data for memory-related metrics: loads and stores, LLC Misses, L1/L2/L3/DRAM bound metrics, etc. The summary overview for our code looks like this:
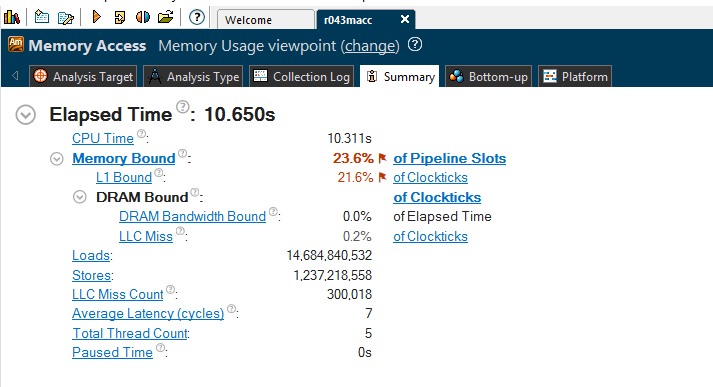
As we can see from the both analyses, our code is memory bounded. There are a lot of CPU cache misses. Let’s try to understand why we have them in the first place, and then let’s think how to address it. I put comments in the code to explain the CPU cache misses:
internal class AhoCorasickTreeNode
{
  // We have two arrays located in different places of the heap.
  // one for buckets
  private int[] _buckets;
  // another for values
  private Entry[] _entries;
  ...

  public AhoCorasickTreeNode GetTransition(char c)
  {
      // access the length of the bucket array's
      var bucket = c % _buckets.Length;

      // access an element of the bucket array
      for (int i = _buckets[bucket]; i >= 0; i = _entries[i].Next)
      {
          // access the value array somewhere on the heap
          if (_entries[i].Key == c)
          {
              return _entries[i].Value;
          }

          // we use a separate chaining method for hash collision resolution
          // if case of hash collision we follow the "Next" pointer
          // which can point to any place of the values array
      }
      return null;
  }

  ...
}
Just to extend all that a bit further, .NET is a safety-first platform. This means .NET ensures that your code won’t access memory not intended for you. For instance in _entries[i].Key it must ensure that you won’t access memory outside of the array. To achieve this, .NET adds a range check that looks like if (i < 0 || i >= _entries.Length) throw .... This means that, even if you access an element in the middle, it needs to load the beginning of the array where the Length is stored. It leads to more loads (and cache misses).
Solution
What can we do about all that? Hmm… we can have just one array, can’t we? We can put our values into the bucket array. What about hash collision resolution then?
It turns out, there’s another method of collision resolution in hash tables called “Open addressing.” With this method a hash collision is resolved by probing, or searching through alternate locations in the array. There are few probing approaches, e.g, Linear, Quadratic, Double hashing, etc. The most CPU cache-friendly method is the Linear one that just puts an element into the next available bucket.
Open addressing is not a silver bullet, of course, and has drawbacks. It is a poor choice for large size elements because they pollute cache. Its performance dramatically degrades when the load factor grows.
It’s all about trade offs. And it seems that Open addressing if the perfect choice for us: it’s cache-friendly, our value record is small (just a pointer), we can control the load factor. Let’s implement it and take a look at the benchmark results:
| Method | Mean | StdDev | Median | Scaled | Scaled-StdDev |
|---|---|---|---|---|---|
| Control | 1,732.3850 ns | 22.5726 ns | 1,726.0844 ns | 1.00 | 0.00 |
| Treatment | 723.2748 ns | 6.9478 ns | 722.9084 ns | 0.42 | 0.01 |
Yeah! We fell into nanoseconds zone. That’s more than 2 times faster! Good job! VTune also confirms that we aren’t memory bound anymore.
Hacks
Performance optimization is an iterative process. Let’s take a look at the General Exploration analysis of the latest optimized version again:
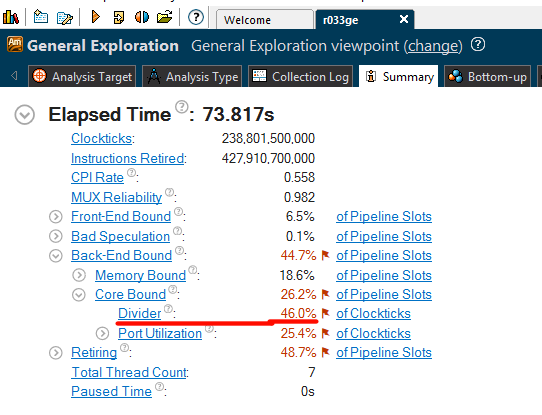
We can spot that VTune Amplifier highlighted the Divider unit, it shows us that almost 50% of execution time spent there. Some arithmetic operations like division and square root take considerably longer than addition or multiplication. They performed by the DIV unit. Indeed, we have a modulo operation in the following code that calculates an index into an array of entries:
public AhoCorasickTreeNode GetTransition(char c)
{
    if (_size == 0) return null;
=>  var ind = c % _size;
    var keyThere = _entries[ind].Key;
...
}
WinDbg will help us understand what it compiles to. The code above compiles to the following assembly code by RuyJIT:
...
; r8d has _size
movzx r9d, dx ; char argument to r9d
mov eax, r9d ; r9d to eax
cdq ; clear edx
idiv r8d ; divide eax by r8d (_size); quotient in ax, remainder in dx
mov eax, edx ; result to eax
...
idiv instruction consumes considerably more CPU cycles than mov or add for example. It can be from 20 to 100 cycles depending on CPU and register size.
VTune Amplifier gives the clue: “The DIV unit is active for a significant portion of execution time. Locate the hot long-latency operation(s) and try to eliminate them. For example, if dividing by a constant, consider replacing the divide by a product of the inverse of the constant. If dividing an integer, see whether it is possible to right-shift instead.” Let’s replace our modulo operation with a well known bit hack; the modulo of powers of 2 can be replaced by a bitwise AND operation. Our code becomes like this:
public AhoCorasickTreeNode GetTransition(char c)
{
    if (_size == 0) return null;
    var ind = c & (_size - 1); // _size needs to be a power of 2
    var keyThere = _entries[ind].Key;
...
}
So that we got rid of the idiv operation and the benchmark results show almost 2 times improvement! Awesome! Interesting enough that VTune was quite precise about 50% time spent in the DIV unit.
| Method | Mean | StdDev | Scaled | Scaled-StdDev |
|---|---|---|---|---|
| Control | 757.1089 ns | 8.5518 ns | 1.00 | 0.00 |
| Treatment | 427.0176 ns | 6.4534 ns | 0.56 | 0.01 |
You can find more interesting bit twiddling hacks on the Stanford university website.
A HUGE mistake

I just realized that I made a huge mistake 😞 I benchmarked and profiled a code in the tight loop like this:
for (var i = 0; i < 1000000; i++)
{
    tree.Contains(UserAgent);
}
The data structure, we are optimizing, is small and less than 32Kb that perfectly fits into L1 CPU cache. In a tight loop all the data resides in the L1 cache that makes it almost free to access (just few cycles). This hides all memory related issues and expose wrong bottlenecks. The code has completely different load profile in production. We access the data structure only once per network request. There is a bunch of other business logic around it, where we read, write and allocate a lot of data. All this means that both the L1 and the L2 CPU caches don’t have the data readily available. Most probably, even the L3 CPU has just a part of it, causing the CPU to stall while waiting for data.
Having said that, we saw a skewed picture and analyzed incorrect bottlenecks. For instance, the recent division optimization won’t be so useful in the wild, the CPU stalls and waits for the data to be transferred from RAM to L3, then to L2, then to L1 and finally to CPU registers.
CPU-friendly code
Let’s take a moment and look at what we have. We built a tree; the tree consists of nodes. A node is a class, it’s stored somewhere on the heap. A node (hash table) contains an array of keys and value, that array is also stored on the heap. All those node classed and arrays scattered around the heap without a clear access pattern. Accessing them CPU needs to request the memory which could lead to a number of expensive cache misses.
What can we do here? We can make the CPU help us! Modern CPUs perform the data prefetching optimization to improve execution performance. CPU can load instructions or data to a cache before it is actually needed. We need to make the memory access pattern easy to reason about for the CPU. The easiest and usually the fastest pattern is the sequential access. Every tree can be put into array, right? Why don’t we put the whole tree into one array?
As a side note, there’s the Software based prefetching too. The compiler can issue the prefetch instructions for the CPU. Unfortunately RyuJIT doesn’t support that yet; but it’s OSS and, who knows, may be you are the one who will bring the support in.
All that justify us to go unsafe!

String traversal
Since we are going unsafe, there is another interesting observation - the user agent string traversal code. The “safe” version of it looks like this:
for (var i = 0; i < userAgent.Length; i++)
{
    var c = userAgent[i];
    ...
}
The loop compiles to the following code:
...
; Block 2:
movsxd r8, eax
movzx r8d, word ptr [rcx+r8*2+0xc]
inc eax
cmp edx, eax
jnle 0x7ffdeecd3d39 ; <Block 2>
...
What do we see here? Each instruction depends on the previous one, hence CPU cannot execute them in parallel. There’s a memory access with complex address calculation. JIT could definitely do a better job, right?
So, unsafe huh?
fixed (char* p = userAgent)
{
    var len = userAgent.Length * 2;
    var cptr = p;
    while (len > 0)
    {
        var c = *cptr;
        cptr++;
        len -= 2;
        ...
    }
}
The loop code:
...
; Block 4:
movzx ecx, word ptr [rax]
add rax, 0x2
add edx, 0xfffffffe
test edx, edx
jnle 0x7ffdeecd3d83 ;<Block 4>
...
Here we have a simple memory access with no calculations. Some of the instructions can be pipelined and executed in parallel.
It gives us 2 times faster traversal in an isolated benchmark:
| Method | Mean | StdDev | Median | Scaled | Scaled-StdDev |
|---|---|---|---|---|---|
| Traverse | 132.5022 ns | 0.9385 ns | 132.1233 ns | 1.00 | 0.00 |
| TraverseUnsafe | 70.7301 ns | 0.1986 ns | 70.6969 ns | 0.53 | 0.00 |
Some ugly code
Having said all the above, without going into details, we flatten tree into an array. We can also compact the array in a way we couldn’t do in the managed environment i.e. store a flag/ data instead a reference to a node.
[
  Node1: [Size, FailureIndex, [Key1, NodeIndex1; KeyN, NodeIndexN;]];
  NodeN: ...
]
The code looks ugly and I’m not proud of it, but performance you know.
public class AhoCorasickTreeSlim
{
    private readonly byte[] _data;

    [MethodImpl(MethodImplOptions.AggressiveInlining)]
    private static unsafe byte GetKey(byte* currentNodePtr, int ind)
    {
        return *(byte*)(currentNodePtr + SizeOfSize + SizeOfFailure + ind * (SizeOfKey + SizeOfNode));
    }

...

    public unsafe bool Contains(string text)
    {
        fixed (byte* b = _data)
        fixed (char* p = text)
        {
            var len = text.Length * 2;
            var currentNodePtr = b;
            var cptr = p;
            while (len > 0)
            {
                var c = *cptr;
                cptr++;
                len -= 2;

                CheckFailure:
                var size = *currentNodePtr;
                var ind = c & (size - 1);
                var key = GetKey(currentNodePtr, ind);
                if (key == c)
                {
                    currentNodePtr = GetNext(b, currentNodePtr, ind);
                    if (currentNodePtr == b) return true;
                }
                else
                {
                    currentNodePtr = GetFailure(b, currentNodePtr);
                    if (currentNodePtr != b) goto CheckFailure;
                }
            }
        }
        return false;
    }
}
How to measure?
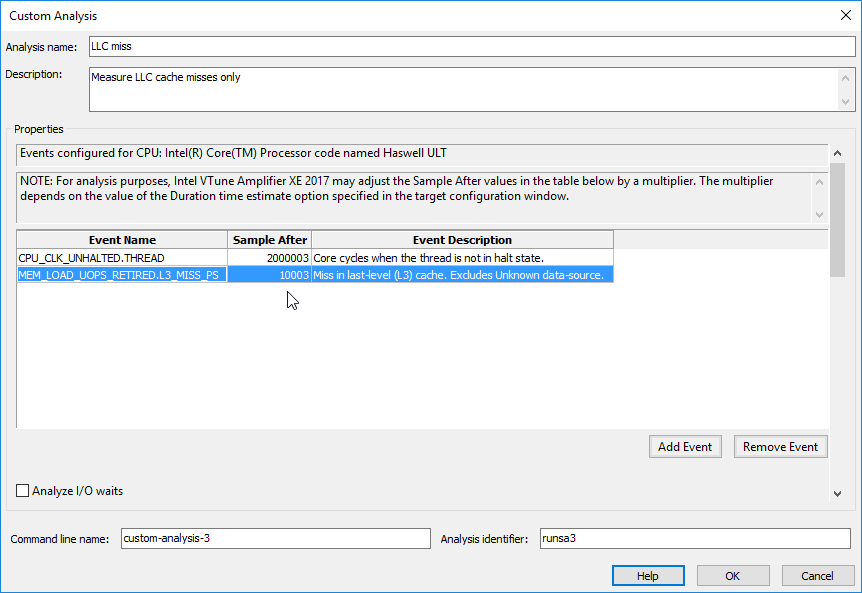
We’ve made some improvement again. But… how to measure these changes? Unfortunately we are stuck in the situation where microbenchmarking doesn’t show us the real picture and became useless. Also it’s quite difficult to measure and profile changes and their impact in the wild. The only way is to employ CPU hardware counters. We already identified the bottleneck as LLC (last-level cache) misses. We are going to monitor only this hardware counter via VTune Amplifier Custom analysis. It’s as simple as selecting interesting hardware events out of hundreds of them:
As for the real-world load profile simulation, let’s do a trick: create an array that is larger than the L3 cache and traverse it before each iteration. This simple trick will clear the CPU cache. Yes, this additional code consumes almost all CPU time, so we need to measure counters for considerable amount of time to get reliable results.
private static readonly byte[] Data = new byte[16 * 1024 * 1024];

for (var i = 0; i < 1000000; i++)
{
    // clear the CPU caches
    var sum = 0;
    for (var j = 0; j < Data.Length; j++)
    {
        sum += Data[j];
    }

    // the code we profile
    tree.Contains(UserAgent);
}
Our custom “LLC misses” analysis results:
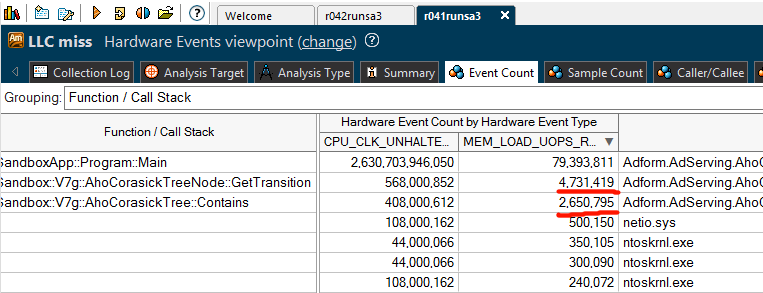
Shows that we encountered more than 7 million LLC misses during our run.
After the optimizations:
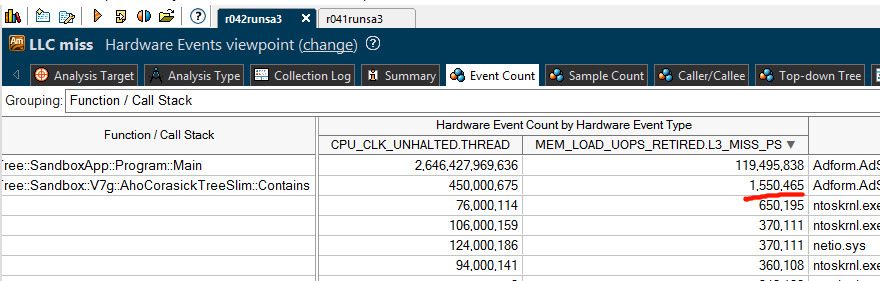
Shows only 1.5 million LLC misses. We managed to reduce number of LLC misses by more than 4 times! Which is amazing! Number of CPU clocks spent in the code also dropped by 2 times. I think it’s safe to say that we improved performance in the wild by 2 times using the latest optimization.
Summary
To summarize the journey, we improved the performance by probably more than 20 times at the end. We used various techniques: from a simple API change to re-implementing the Dictionary data structure, from the Open addressing Hash table to the modulo bit hack, from admitting our own mistakes to making the algorithm more CPU-friendly.
What can we do next? Obviously, compacting the data structure even more will improve the performance because we would simply load less data. We can find the perfect hash function to have less hash collisions. We can do it programmatically as we know our data beforehand. If we study the data we find out that it’s ASCII only and most of the patterns consist of English characters with few exceptions. Therefore we can create bit masks for them and use bitwise operations. To evolve it further we could use SIMD (Single instruction, multiple data) instructions and check few input characters at once. But all that is another story.
Leave a Comment